Note
Go to the end to download the full example code.
Use the STScI PHOENIX grid#
This example shows how to use the ST grid.
from astropy import units as u
import numpy as np
import matplotlib.pyplot as plt

from GridPolator import GridSpectra
from GridPolator import config
Load the PHOENIX grid#
Load the default VSPEC PHOENIX grid.
wave_short = 1*u.um
wave_long = 2*u.um
resolving_power = 100
teffs = [3000,3100]
metalicities = [-1.0,-0.5]
loggs = [3.5,4.0]

spec = GridSpectra.from_st(
    w1=wave_short,
    w2=wave_long,
    resolving_power=resolving_power,
    teffs=teffs,
    metalicities=metalicities,
    loggs=loggs,
    impl_bin='rust',
    impl_interp='scipy',
)
Loading Teff Axis:   0%|          | 0/2 [00:00<?, ?it/s]

Loading Metallicity Axis:   0%|          | 0/2 [00:00<?, ?it/s]PHOENIX grid for 3000 -1.0 not found. Downloading...


Loading Logg Axis:   0%|          | 0/2 [00:00<?, ?it/s]
Loading Logg Axis: 100%|██████████| 2/2 [00:00<00:00, 147.46it/s]


Loading Metallicity Axis:  50%|█████     | 1/2 [00:00<00:00,  5.38it/s]PHOENIX grid for 3000 -0.5 not found. Downloading...


Loading Logg Axis:   0%|          | 0/2 [00:00<?, ?it/s]
Loading Logg Axis: 100%|██████████| 2/2 [00:00<00:00, 155.47it/s]


Loading Metallicity Axis: 100%|██████████| 2/2 [00:00<00:00,  7.38it/s]
Loading Metallicity Axis: 100%|██████████| 2/2 [00:00<00:00,  6.99it/s]

Loading Teff Axis:  50%|█████     | 1/2 [00:00<00:00,  3.49it/s]

Loading Metallicity Axis:   0%|          | 0/2 [00:00<?, ?it/s]PHOENIX grid for 3100 -1.0 not found. Downloading...


Loading Logg Axis:   0%|          | 0/2 [00:00<?, ?it/s]
Loading Logg Axis: 100%|██████████| 2/2 [00:00<00:00, 124.75it/s]


Loading Metallicity Axis:  50%|█████     | 1/2 [00:00<00:00,  8.92it/s]PHOENIX grid for 3100 -0.5 not found. Downloading...


Loading Logg Axis:   0%|          | 0/2 [00:00<?, ?it/s]
Loading Logg Axis: 100%|██████████| 2/2 [00:00<00:00, 159.84it/s]


Loading Metallicity Axis: 100%|██████████| 2/2 [00:00<00:00,  8.35it/s]
Loading Metallicity Axis: 100%|██████████| 2/2 [00:00<00:00,  8.42it/s]

Loading Teff Axis: 100%|██████████| 2/2 [00:00<00:00,  3.88it/s]
Loading Teff Axis: 100%|██████████| 2/2 [00:00<00:00,  3.81it/s]
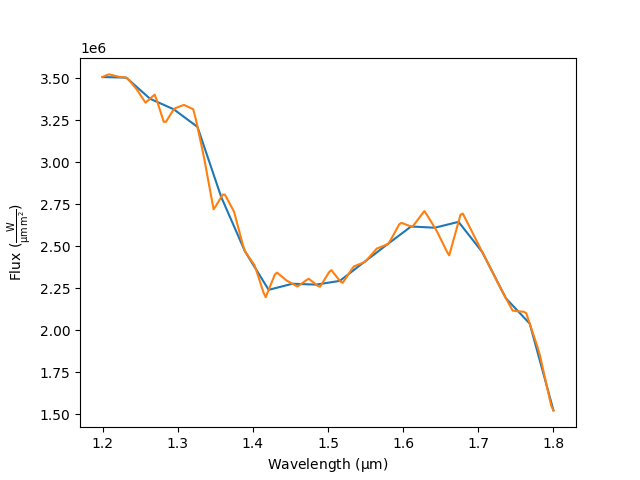
Recall a spectrum from the grid#
GridSpectra will resample the grid with your supplied
wavelength array as well as interpolate between \(T_{eff}\) values.
low_res:u.Quantity = np.linspace(1.2,1.8,20) * u.um
hi_res:u.Quantity = np.linspace(1.2,1.8,200) * u.um
teff = np.array([3050.])
metalicity = np.array([-0.6])
logg = np.array([3.7])

low_res = np.array(low_res.to_value(config.wl_unit))
hi_res = np.array(hi_res.to_value(config.wl_unit))

flux_lo = spec.evaluate((teff,metalicity,logg), low_res)[0]
flux_hi = spec.evaluate((teff,metalicity,logg), hi_res)[0]

plt.plot(low_res, flux_lo)
plt.plot(hi_res, flux_hi)
plt.xlabel(f'Wavelength ({config.wl_unit:latex})')
_=plt.ylabel(f'Flux ({config.flux_unit:latex})')
Total running time of the script: (0 minutes 0.673 seconds)