Note
Go to the end to download the full example code.
Plot the lightcurve stellar granulation#
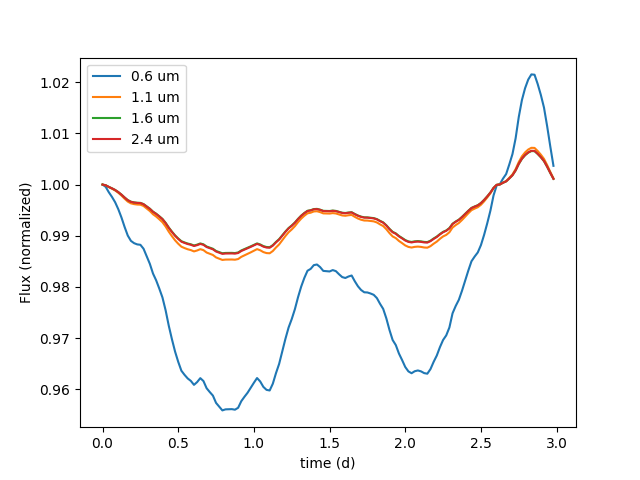
This example plots the lightcurve effects caused by granulation on the surface of a star.
Saved settings to /home/runner/.libpypsg/settings.json
Reloading settings...
Initialize the VSPEC run parameters#
For this example, we will create the parameter objects explicitly. This can also be done using a YAML file.
header = params.Header(
    data_path=Path('.vspec/granulation_lightcurve'),
    seed=SEED,verbose=0,
    spec_grid = params.VSPECGridParameters(
        max_teff=3400*u.K,min_teff=3000*u.K,
        impl_bin='rust',impl_interp='scipy',fail_on_missing=False
    )
)
star = params.StarParameters(
    psg_star_template='M',
    teff=3300*u.K,
    mass = 0.1*u.M_sun,
    radius=0.15*u.R_sun,
    period = 10*u.day,
    misalignment_dir=0*u.deg,
    misalignment=0*u.deg,
    ld = params.LimbDarkeningParameters.solar(),
    faculae=params.FaculaParameters.none(),
    spots=params.SpotParameters.none(),
    flares=params.FlareParameters.none(),
    granulation=params.GranulationParameters(
        mean=0.2,
        amp=0.005,
        period=6*u.hr,
        dteff=300*u.K
    ),
    grid_params=(500, 1000),
)
planet = params.PlanetParameters.std(init_phase=180*u.deg,init_substellar_lon=0*u.deg)
system = params.SystemParameters(
    distance=1.3*u.pc,
    inclination=30*u.deg,
    phase_of_periastron=0*u.deg
)
observation = params.ObservationParameters(
    observation_time=3*u.day,
    integration_time=30*u.min
)
psg_params = params.psgParameters(
    gcm_binning=200,
    phase_binning=1,
    use_molecular_signatures=True,
    use_continuum_stellar=True,
    nmax=0,
    lmax=0,
    continuum=['Rayleigh', 'Refraction', 'CIA_all'],
)
instrument = params.InstrumentParameters.niriss_soss()

def gcm_getter():
    return vspec_to_pygcm(
        shape=(30,30,30),
        epsilon=7,
        star_teff=3800*u.K,
        r_star=0.2*u.R_sun,
        r_orbit=0.05*u.AU,
        lat_redistribution=0.0,
        p_surf=1*u.bar,
        p_stop=1e-5*u.bar,
        wind_u=0*u.km/u.s,
        wind_v=0*u.km/u.s,
        albedo=0.3,
        emissivity=1.0,
        gamma=1.4,
        molecules={'CO2':1e-4}
    )
gcm = params.gcmParameters(
    gcm_getter=gcm_getter,
    mean_molec_weight=28,
    is_static=True
)

parameters = params.InternalParameters(
    header = header,
    star = star,
    planet = planet,
    system = system,
    obs=observation,
    psg = psg_params,
    inst=instrument,
    gcm = gcm
)
Run the simulation#
model = ObservationModel(params=parameters)
model.build_planet()
model.build_spectra()
Creating interpolators:
thermal
thermal, combined
thermal, combined, stellar
thermal, combined, stellar, photon noise
thermal, combined, stellar, photon noise, detector noise
thermal, combined, stellar, photon noise, detector noise, telescope noise
thermal, combined, stellar, photon noise, detector noise, telescope noise, background noise
thermal, combined, stellar, photon noise, detector noise, telescope noise, background noise, transit
Finished!

Loading Spectra:   0%|          | 0/5 [00:00<?, ?it/s]
Loading Spectra:  20%|██        | 1/5 [00:00<00:01,  3.44it/s]
Loading Spectra:  40%|████      | 2/5 [00:00<00:00,  3.41it/s]
Loading Spectra:  60%|██████    | 3/5 [00:00<00:00,  3.40it/s]
Loading Spectra:  80%|████████  | 4/5 [00:01<00:00,  3.39it/s]
Loading Spectra: 100%|██████████| 5/5 [00:01<00:00,  3.38it/s]
Loading Spectra: 100%|██████████| 5/5 [00:01<00:00,  3.39it/s]
Load in the data#
We can use VSPEC to read in the synthetic data we just created.
data = PhaseAnalyzer(model.directories['all_model'])

wl_pixels = [0,300,500,700]
time = data.time.to(u.day)
for i in wl_pixels:
    wl = data.wavelength[i]
    lc = data.lightcurve(
        source='star',
        pixel=i,
        normalize=0
    )
    plt.plot(time,lc,label=f'{wl:.1f}')
plt.legend()
plt.xlabel(f'time ({time.unit})')
_=plt.ylabel('Flux (normalized)')

Total running time of the script: (6 minutes 37.218 seconds)
